Turn Viewer Metrics Into Competitive Advantages
Know exactly what your audience loves. Analyze and track every piece of content's performance and impact with fast, reliable OTT analytics & AI tools that turn raw streaming data into real-time insights, revealing what drives the most views, engagement, and revenue.
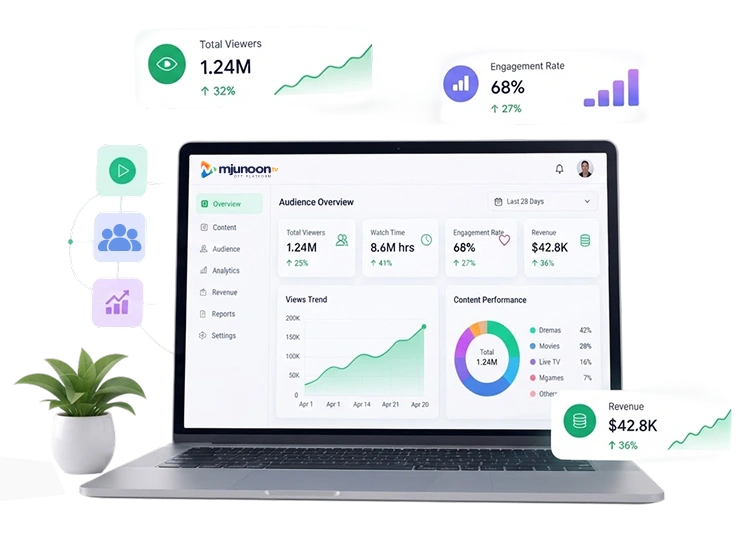
Measure User Engagement &
Adjust Content Accordingly
Analyze and track the performance of all your content at the minute level to drive
growth, retain subscribers,
and optimize costs.

Detailed Revenue Reports
Turn revenue from every monetization model into granular, actionable financial insights, so you know exactly what’s driving revenue.

Content Performance Insights
See which content earns the most views, watch time, and engagement; focus on what works, improve the user experience, and grow revenue.

Per-User Behavior Tracking
Track and analyze viewer interactions, including pauses, skips, device switches, and search queries, to understand what works.

Device and Browser Stats
Collect detailed information about the user’s device and browser to improve streaming, personalize experiences, and grow revenue.

Google Analytics Integration
Track viewer behavior and CTR, automate marketing, and measure performance on the go to maximize your streaming channel's performance.

Partner Content Analytics
Combining data tracking with machine learning to optimize viewer retention, streaming performance, and monetization on the go.
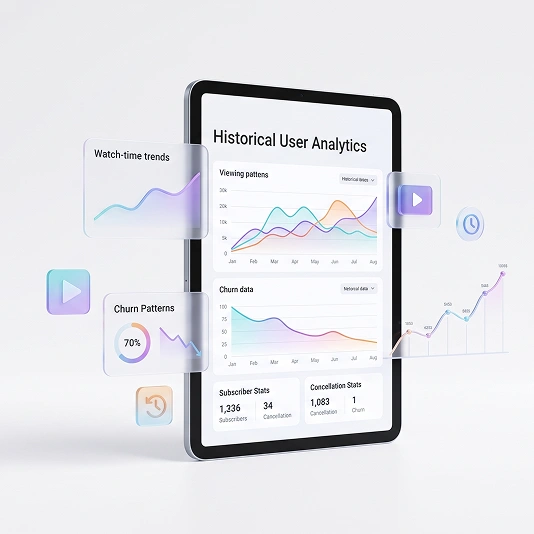
Historical User Analytics
Go beyond current activity by analyzing past viewing behavior among registered, subscriber, PPV, and canceled users. Identify churn patterns, optimize content strategy, improve completion rates, refine monetization and pricing, and make informed business decisions.
- Measure subscription purchases during marketing campaigns.
- Track cancellations by period, identify root causes, and forecast future attrition.
- Identify trends, optimize pricing, and forecast revenue from one-time purchases.
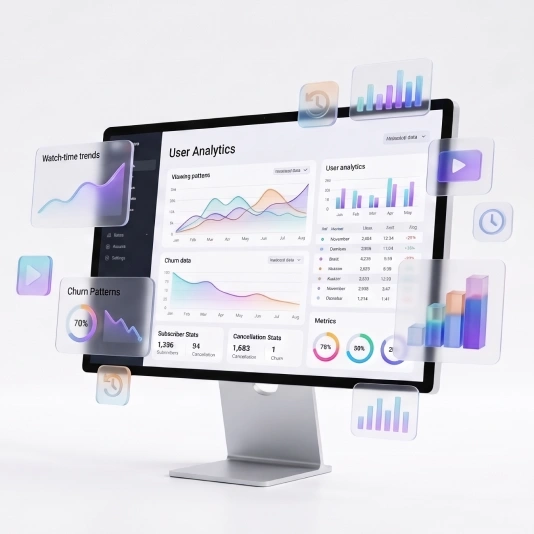
The Right View for Your Data
Turn complex streaming data into clear visuals. Choose line, bar, column, pie, or area charts to track trends, compare content, and better understand your audience, so you can back every decision with data you can read at a glance.
- Clear visuals show where to spend the content budget.
- Charts are ready for stakeholder and investor presentations.
- Marketing, content, and finance teams can understand the data on their own.
Make Your Viewer Data
Your Edge
Explore how real-time OTT analytics can transform streaming metrics into
smarter content, stronger retention, and increased
revenue.
Turn Data Into Insights,
Decisions, & Revenue
Here are the most common questions we receive from
businesses considering OTT analytics & AI.